Measures of Variability — Range, IQR, Variance and Standard Deviation
Agenda
1. What is Variability?
2. Range
3. Interquartile Range
4. Variance
5. Standard Deviation
6. What’s the best measure of variability?
Variability describes how far apart data points lie from each other and from the center of a distribution.
Variability is also referred to as spread, scatter or dispersion. This is important because it tells you whether the points tend to be clustered around the center or more widely spread out.
Low variability is ideal because it means that you can better predict information about the population based on sample data. High variability means that the values are less consistent, so it’s harder to make predictions.

Different Measures of Variation
Range

The range tells you the spread of your data from the lowest to the highest value in the distribution.
For example, consider the following numbers: 1, 3, 4, 5, 5, 6, 7, 11. For this set of numbers, the range would be 11–1 or 10.

Because only 2 numbers are used, the range is influenced by outliers and doesn’t give you any information about the distribution of values. It’s best used in combination with other measures.
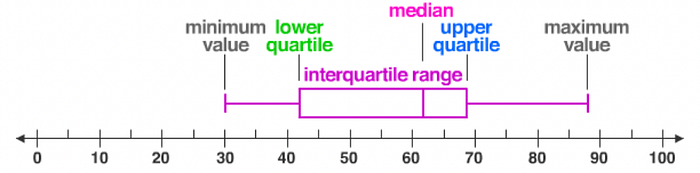
Interquartile range

The interquartile range gives you the spread of the middle of your distribution.
For any distribution that’s ordered from low to high, the interquartile range contains half of the values. While the first quartile (Q1) contains the first 25% of values, the fourth quartile (Q4) contains the last 25% of values.
It is a measure of how data is spread around the mean. The basic formula is:
IQR = Q3 — Q1Just like the range, the interquartile range uses only 2 values in its calculation. But the IQR is less affected by outliers: the 2 values come from the middle half of the data set, so they are unlikely to be extreme scores.
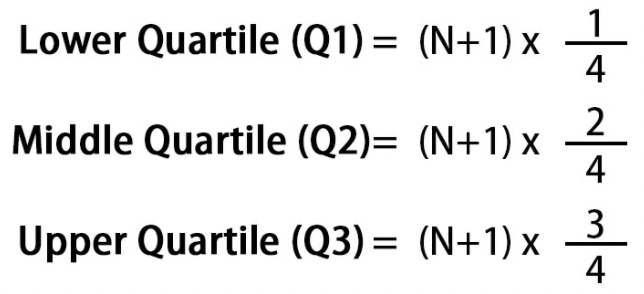
Five-number summary
Every distribution can be organized using a five-number summary:
- Lowest value
- Q1: 25th percentile
- Q2: the median
- Q3: 75th percentile
- Highest value (Q4)
Variance

Variance tells you how far a data set is spread out, but it is an abstract number.
Variance reflects the degree of spread in the data set. The more spread the data, the larger the variance is in relation to the mean.
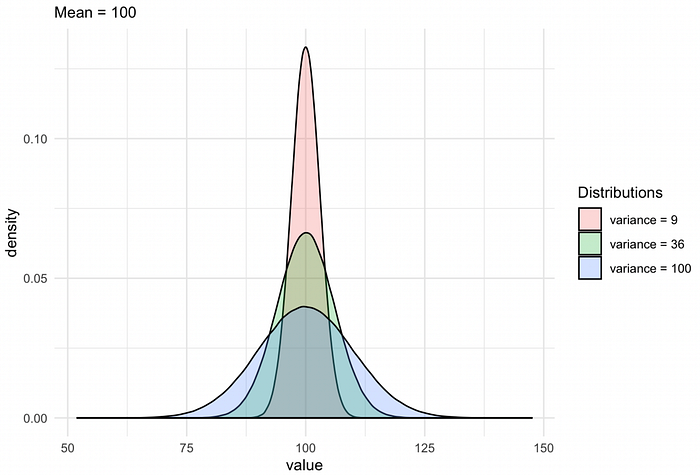
Small Variance — Data points tend to be very close to the mean and to each other
High Variance — Data points are very spread out from mean and from each other
Zero Variance — All data values are identical
Standard Deviation
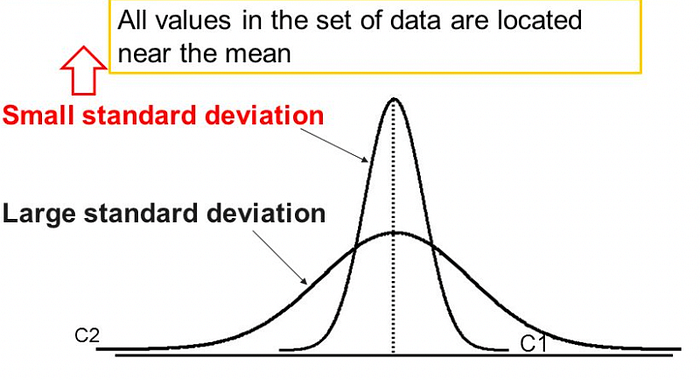
Standard deviation is the average amount of variability in your dataset. It tells you, on average, how far each score lies from the mean.
The larger the standard deviation, the more variable the data set is.
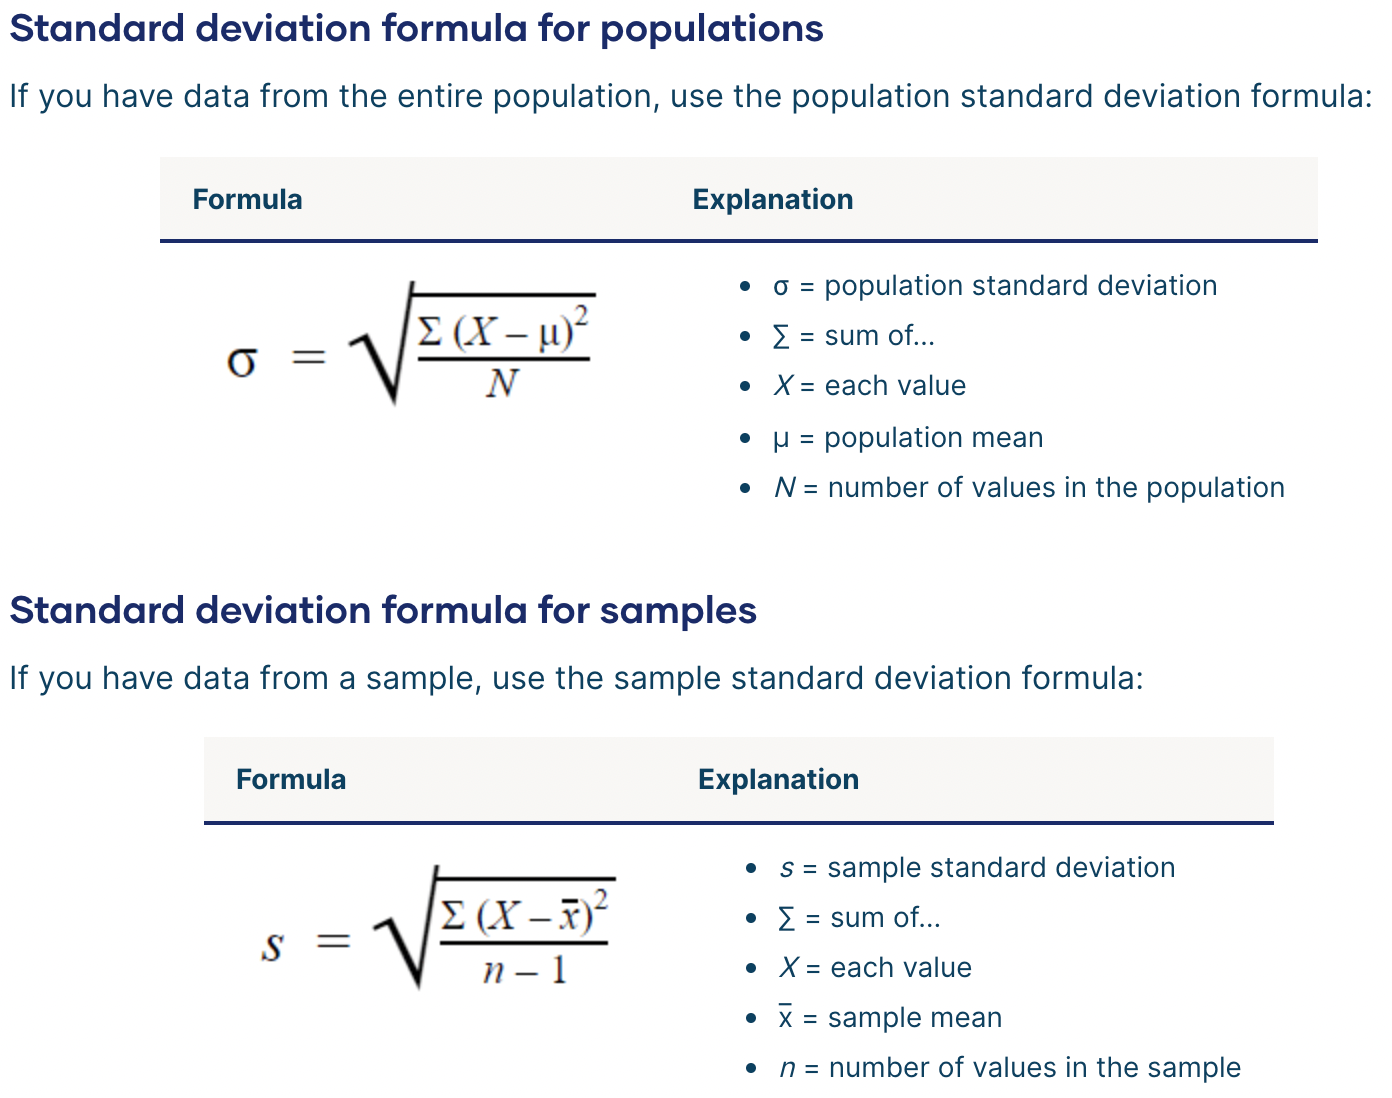
Why use n — 1 for sample standard deviation?
Samples are used to make statistical inferences about the population that they came from.
When you have population data, you can get an exact value for population standard deviation. Since you collect data from every population member, the standard deviation reflects the precise amount of variability in your distribution, the population.
But when you use sample data, your sample standard deviation is always used as an estimate of the population standard deviation. Using n in this formula tends to give you a biased estimate that consistently underestimates variability.
Reducing the sample n to n — 1 makes the standard deviation artificially large, giving you a conservative estimate of variability.
While this is not an unbiased estimate, it is a less biased estimate of standard deviation: it is better to overestimate rather than underestimate variability in samples.
What’s the best measure of variability?
The best measure of variability depends on your level of measurement and distribution.
Level of measurement
For data measured at an ordinal level, the range and interquartile range are the only appropriate measures of variability.
For more complex interval and ratio levels, the standard deviation and variance are also applicable.
Distribution
For normal distributions, all measures can be used. The standard deviation and variance are preferred because they take your whole data set into account, but this also means that they are easily influenced by outliers.
For skewed distributions or data sets with outliers, the interquartile range is the best measure. It’s least affected by extreme values because it focuses on the spread in the middle of the data set.